Skip to content
About
Projects
About
Projects
Contact Me
Work & Personal Projects
All
Blog
Case Study
Data Visualization
Machine Learning
Neural Networks
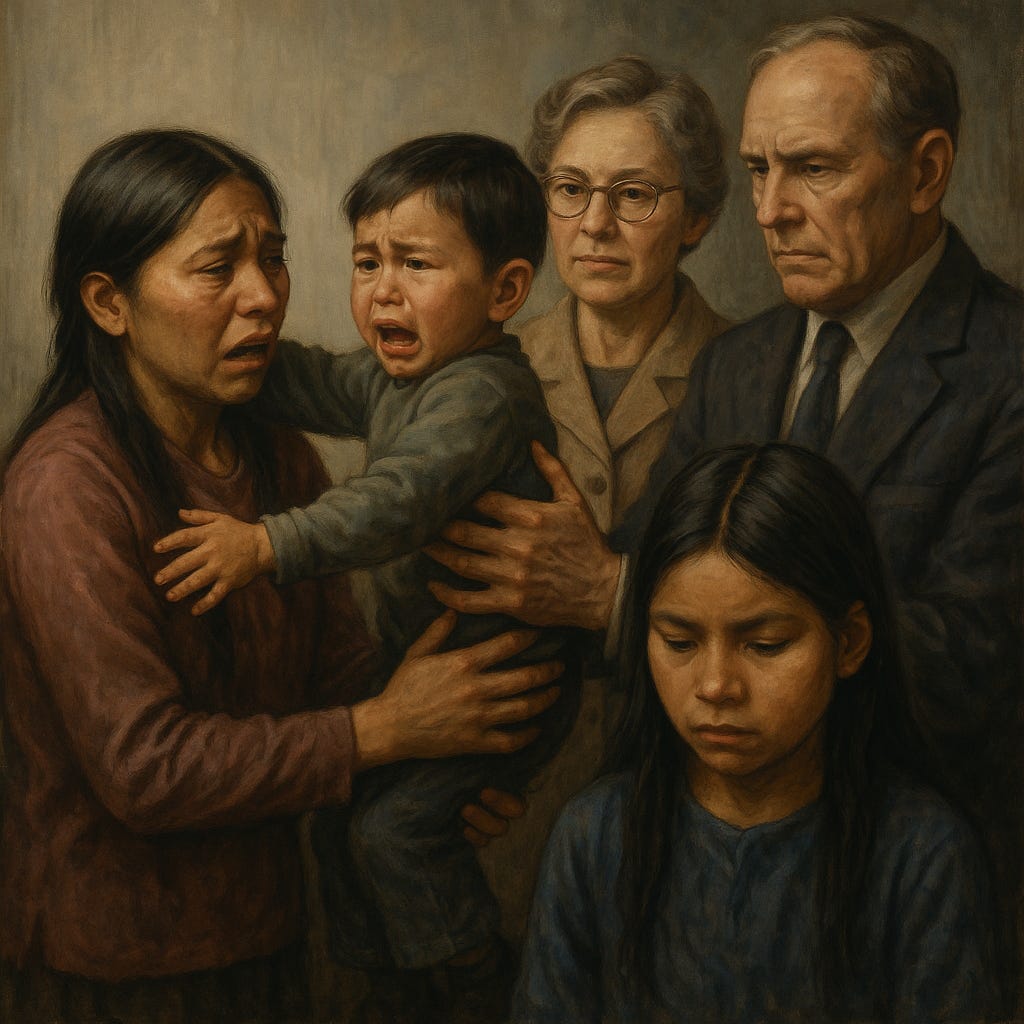
Debunking Denialism About Canada’s Sixties Scoop Policy
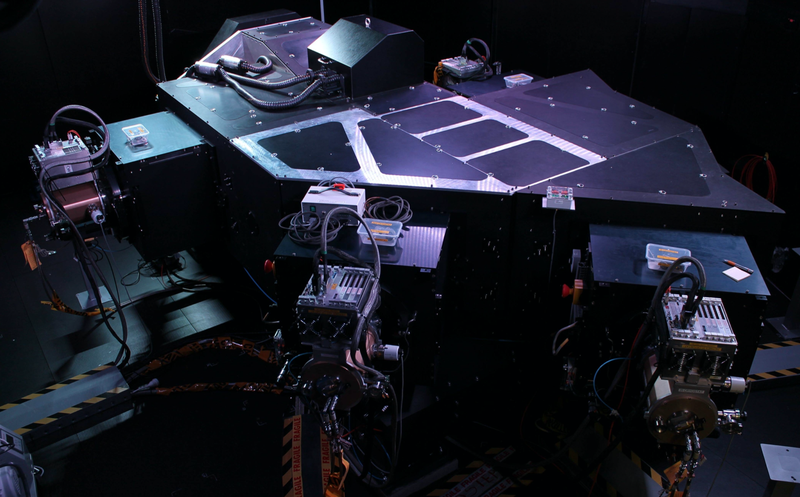
A Deep Generative Model for Stellar Spectra: A Case Study in Machine Learning
My Journey in Health Tech: Building Secure Healthcare Solutions in Barrie with metricHEALTH
CarePal: Developing an Award-Winning AI Companion at the Georgian College Hackathon
AutoML vs. Deep Learning: A Case Study in Forecasting Iowa’s Liquor Sales
Case Study: How does a bike-share navigate speedy success?
Case Study: A Century of Natural Disasters: Unveiling the Global Impact, Trends, and Response
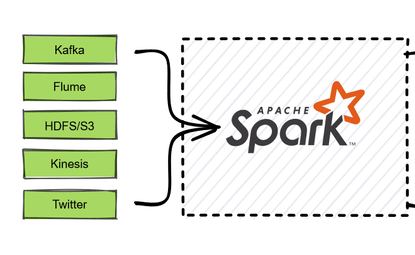
Real-Time ETL : Apache Spark and Kafka Enterprise Data Processing
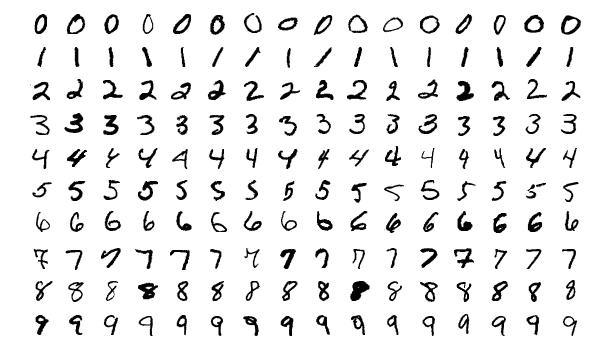
Creating Neural Networks from Scratch Using Numpy and Math
Stars type classification: A Machine Learning Project
Get In Touch !
What is the reason for contact?
Reason For Contact
AI Project Work
Business Consultation
Data Analysis Project
Website Design
Just want to say Hi :)
How can I reach you ?
Name
Email
What would you like to discuss?
Message
Send