Incoming MSc CS · open to part-time & contract ML
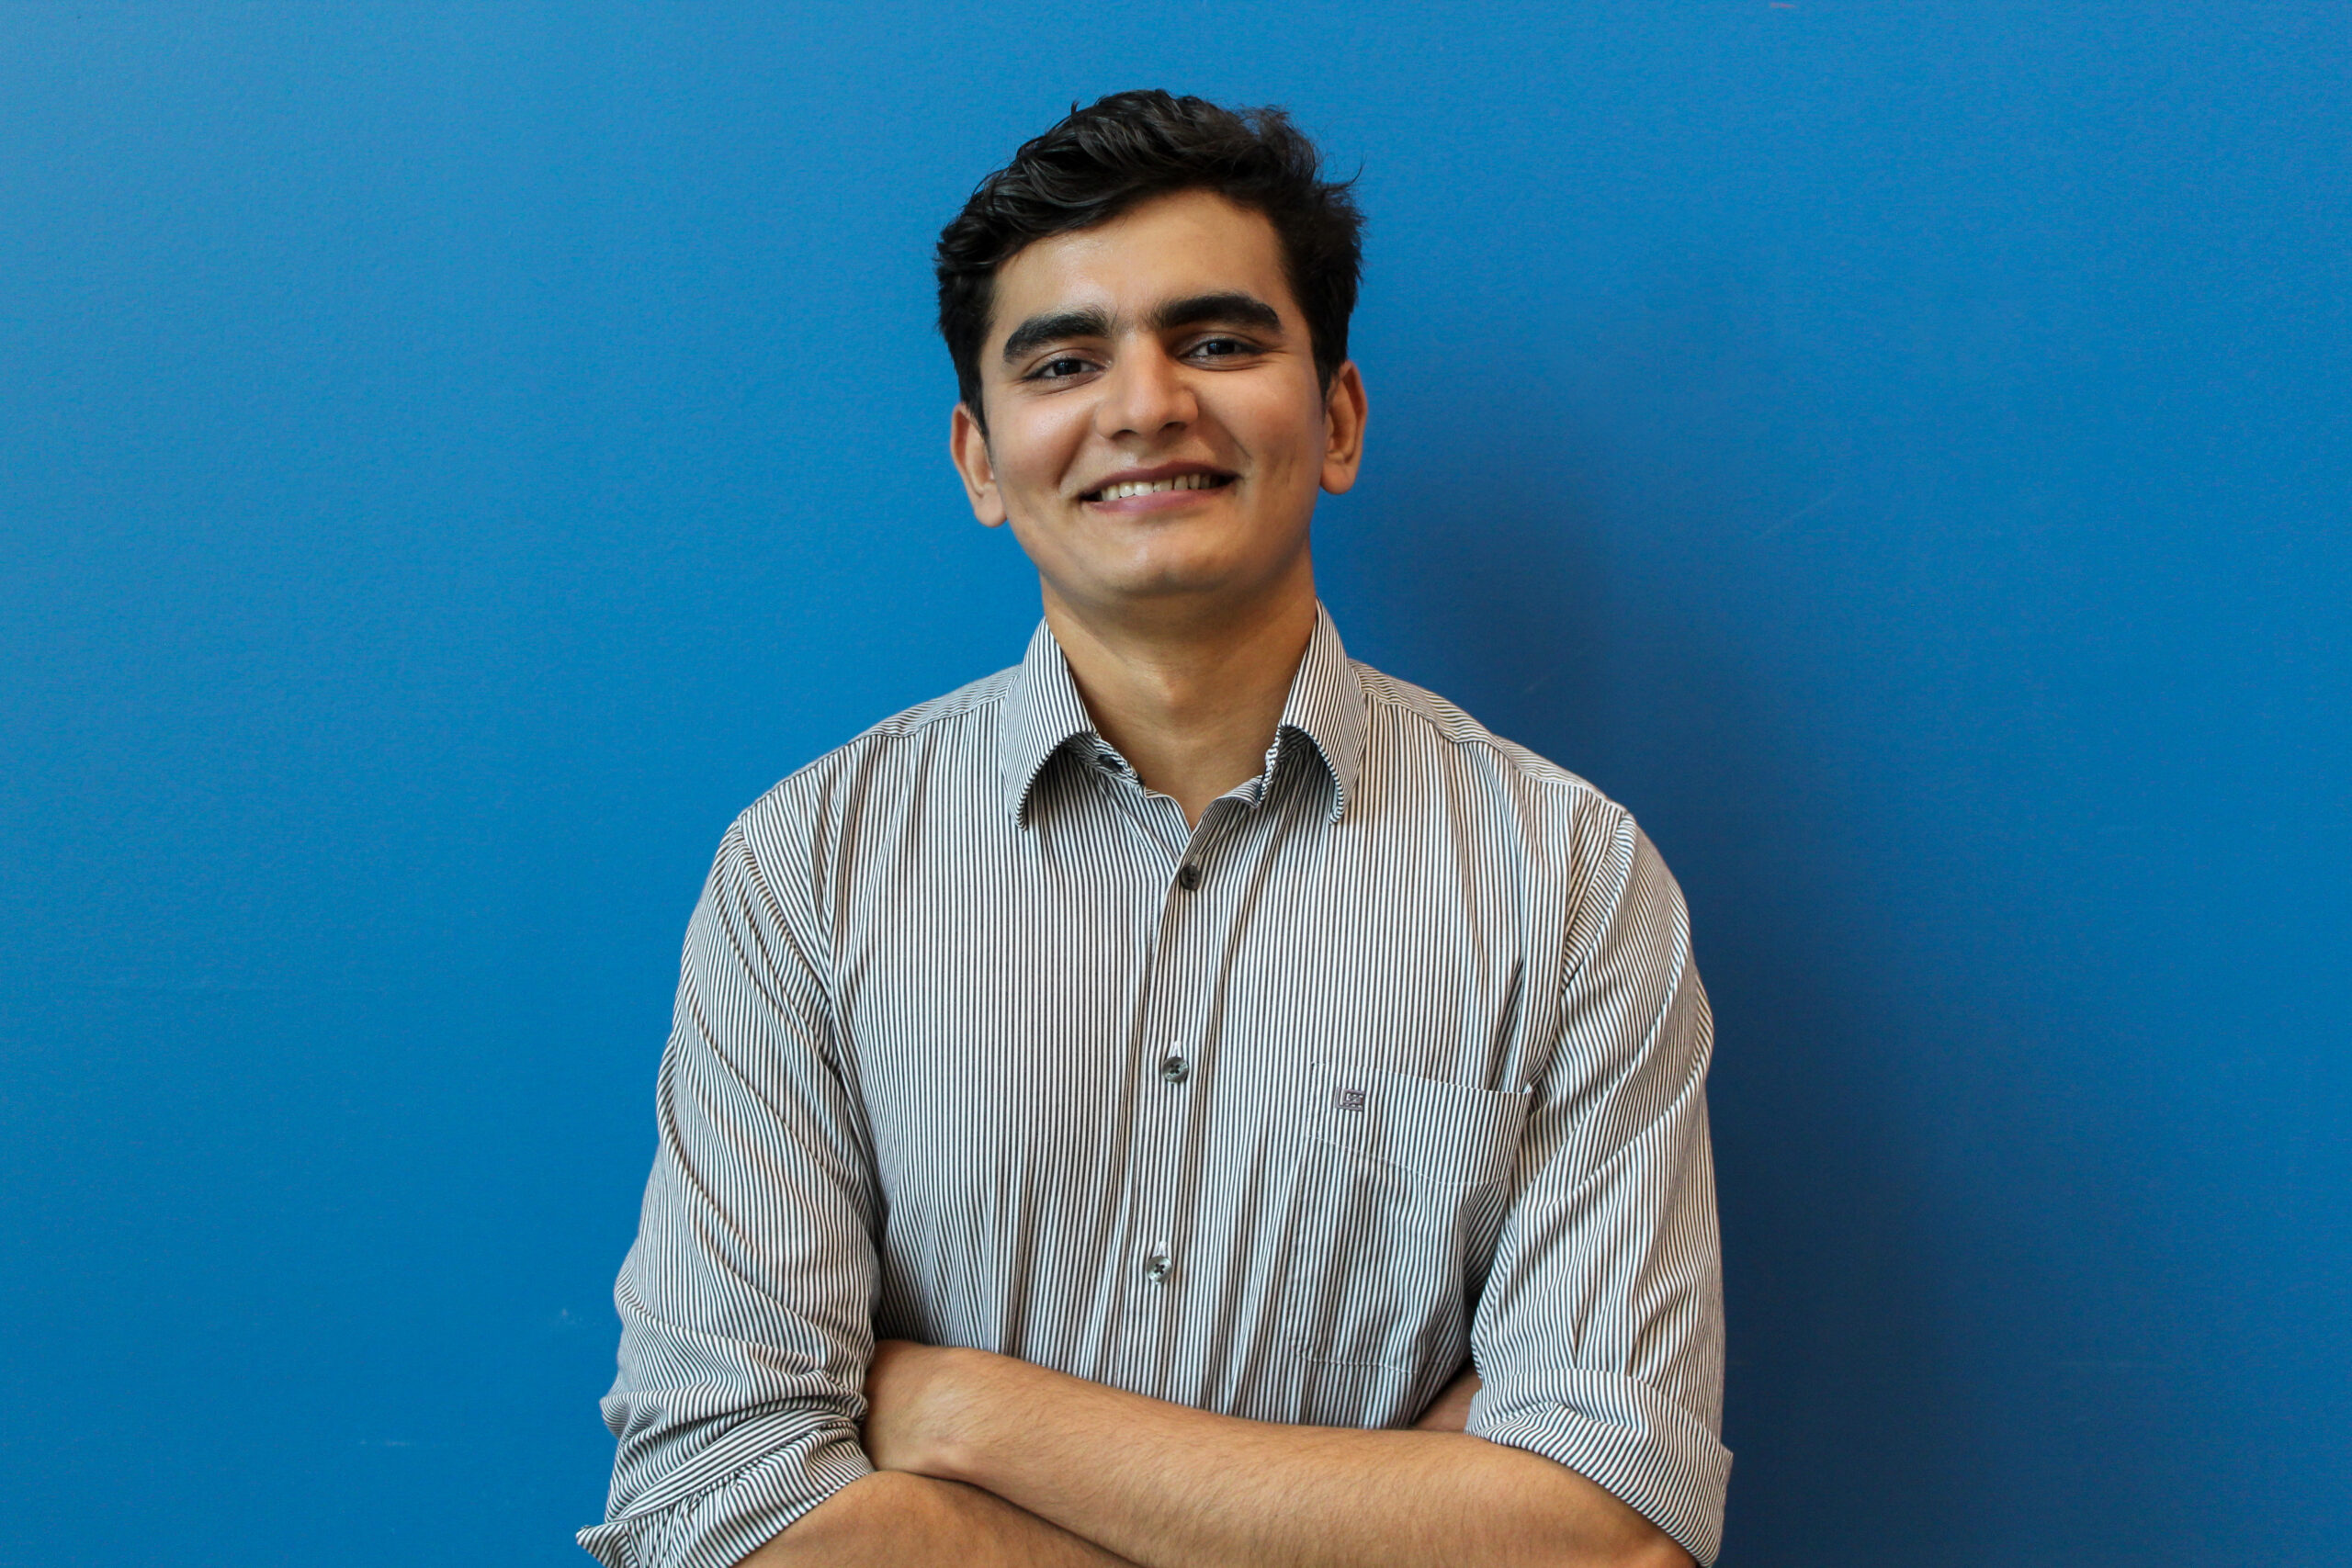
Hi, I am TJ
I build machine learning systems and think about how models actually work, where they break, and what it takes to ship them into the world. Physics is where I started, and I still think with that grain. Ask why. Look for the mechanism. Test what you believe. The work splits between scientific machine learning, interpretability, and the engineering that takes a model from notebook to real service. I care about building things that are worth trusting.
Selected Work
Recent projects
Three streams of work in rotation: production, research, and community.
Production Work
Systems built and shipped, mostly at metricHEALTH.


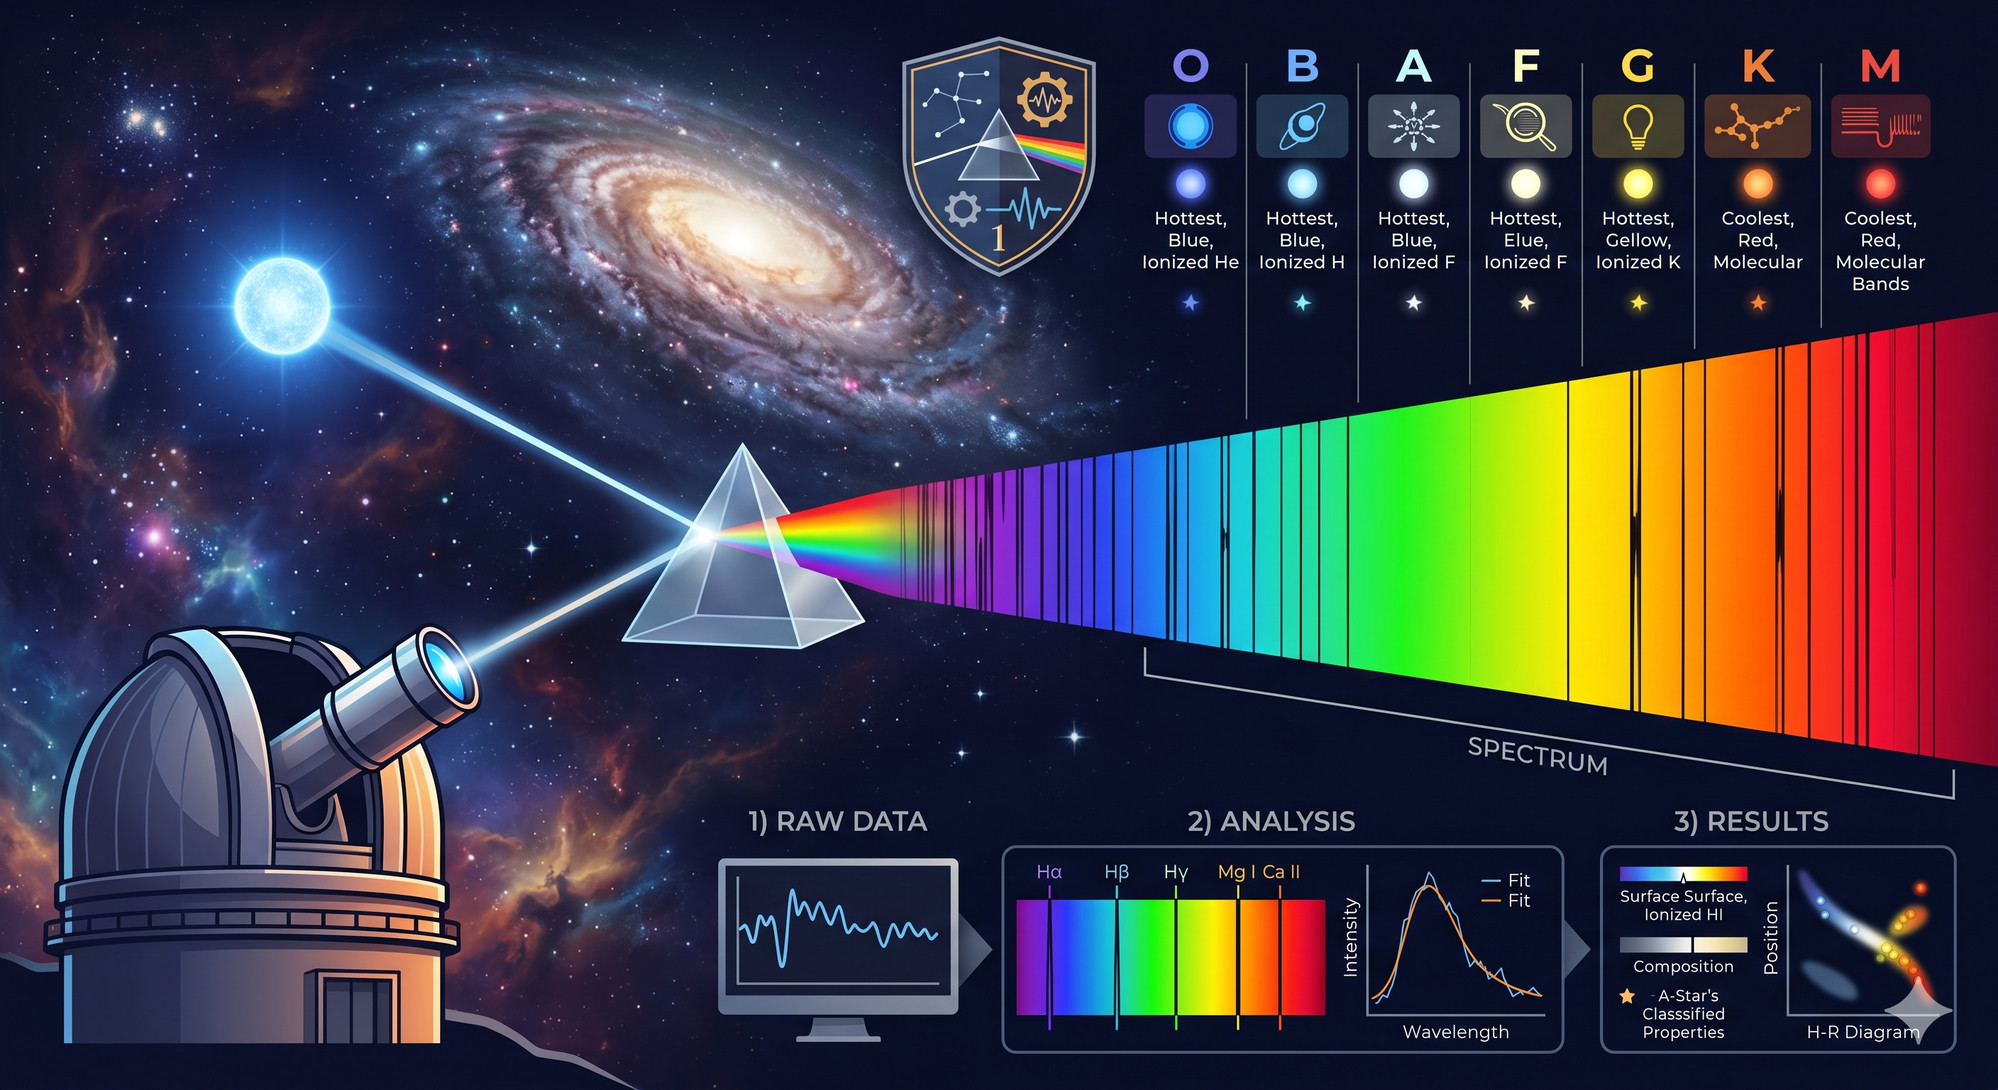
Research
Scientific ML, interpretability, generative modelling, and computational physics.

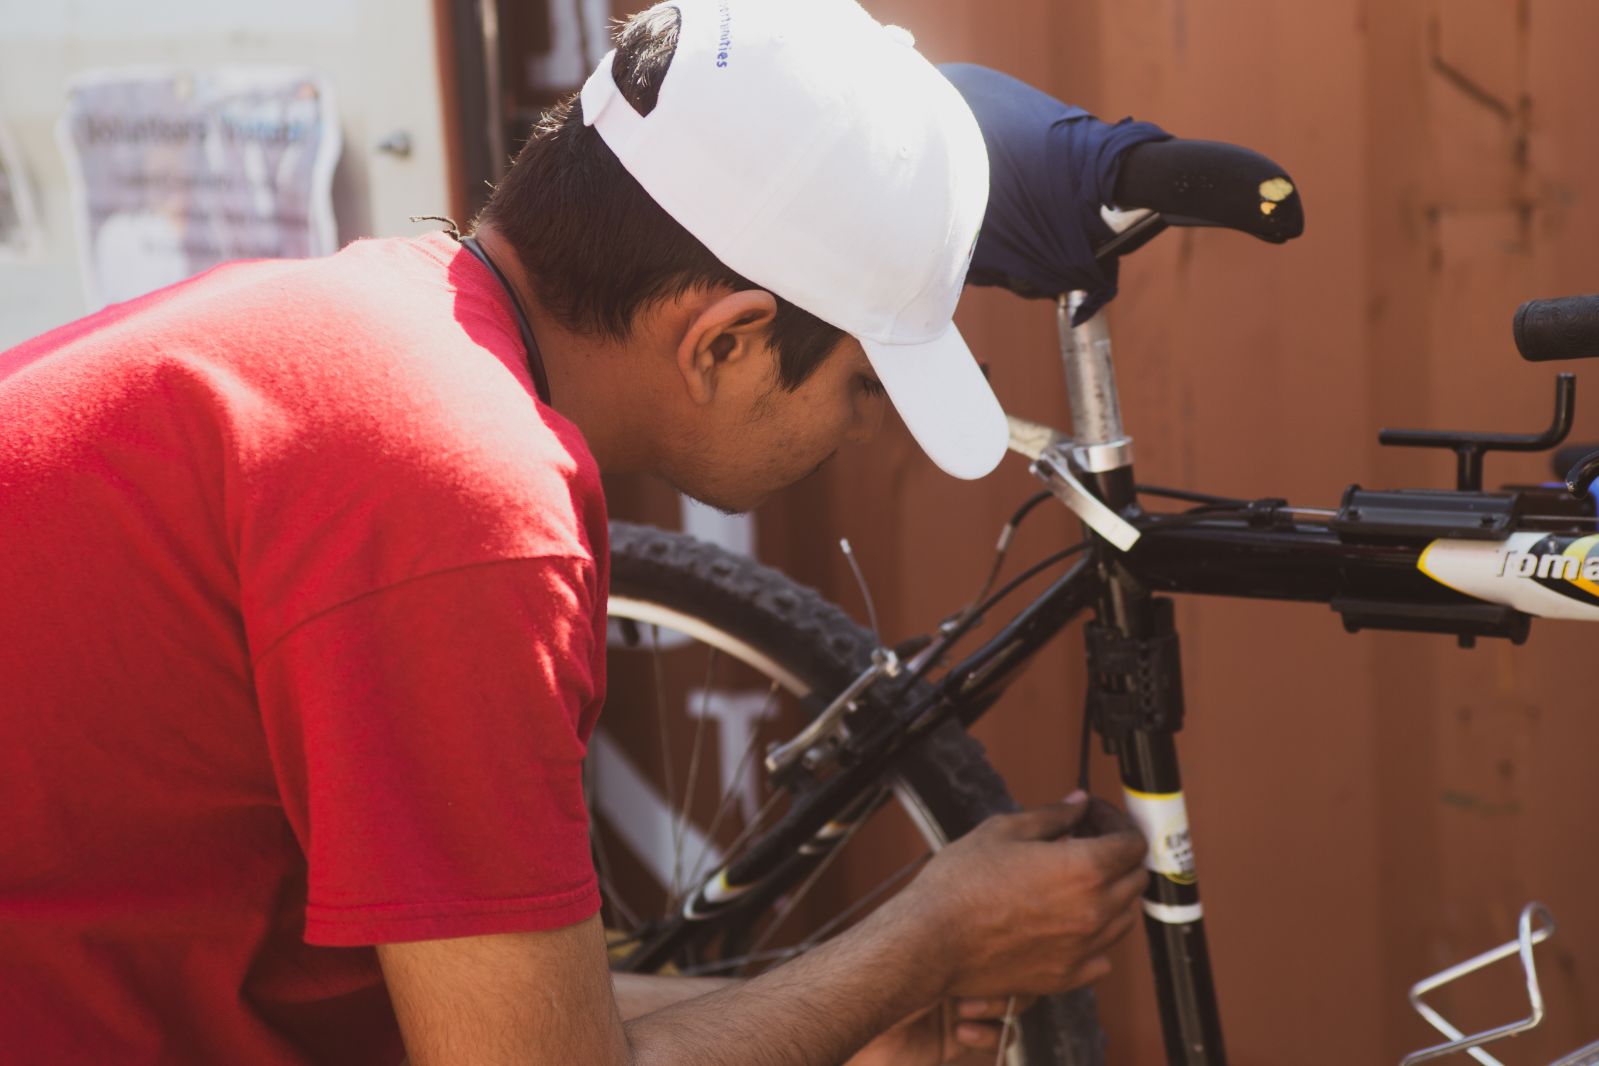
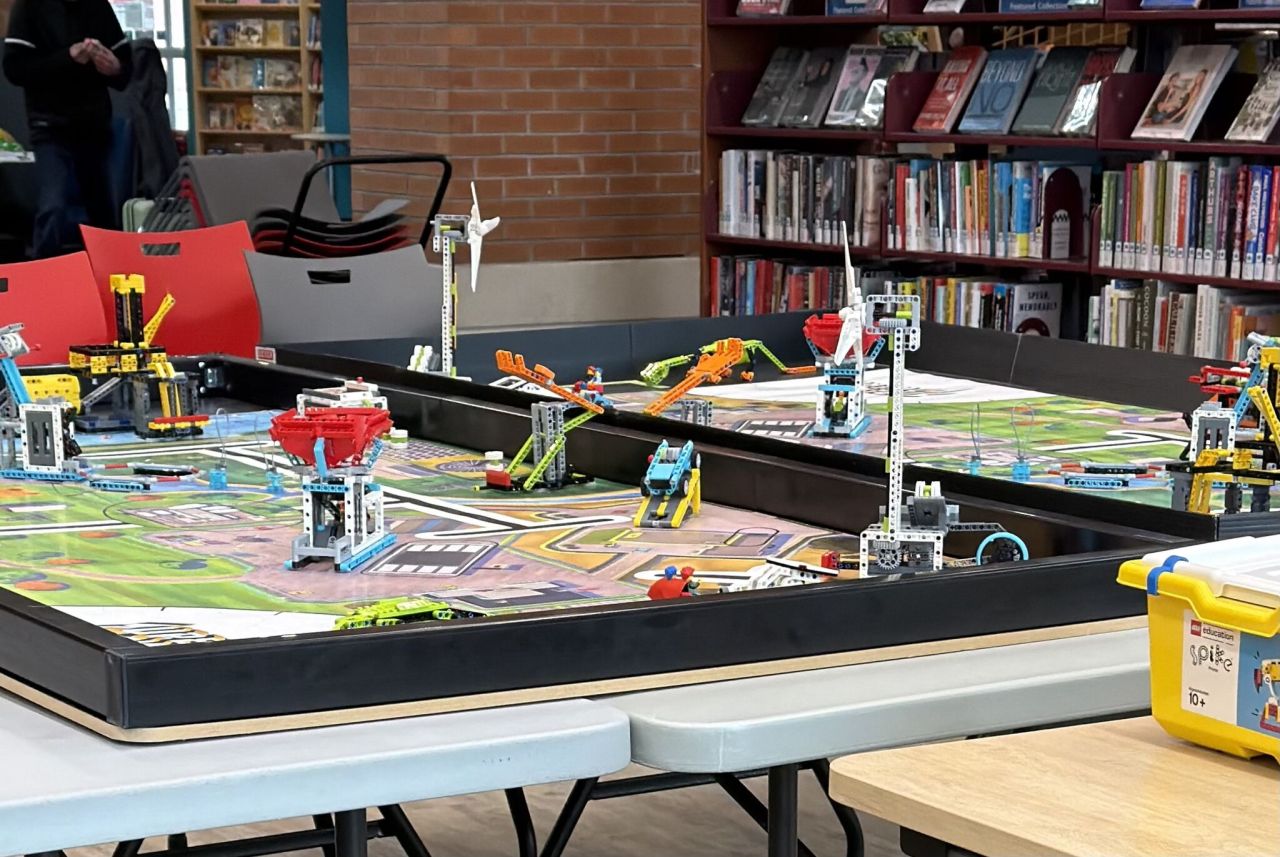
Community
Programs run from Barrie Public Library and adjacent volunteer work.