Tirthesh Jani

Without music life would be a mistake

Last Friday, I got invited to the Mariposa Folk Music Festival. I said yes immediately despite having a lot of deadlines and work to finish. My first “concert” experience here in Canada I didn’t want to let that opportunity go and I am glad I didn’t. As a person who loves all sorts of music, it was a fun experience to hear some Canadian and American artists perform live. I got introduced to artists like Bahamas, Shad, Noah Cyrus and William prince. I couldn’t get to hear Band of Horses (I have known this band for a long time. but that’s okay). On top of all these artists I know some of you have introduced me to some cool indie artists like Ritchy Mitch and the coal miners or the Tragically Hip and I got a lot introduced to some cool songs from the karaoke lists that was posted a few weeks ago.I can proudly say my taste in music has diversified over the years on top of the sounds of India I have heard music from a lot of different countries and a lot of different genres whether it’s old school rock , Japanese 80s pop, Filipino indie music , the soulful lyrical Urdu music from Pakistan, groovy dance music in Swahili ,some beautiful French tunes, some Nordic folk music or even the good old classical piano music I have heard and appreciated all of it even though I don’t understand the language.There’s a song for every mood, every moment, and every emotion. It’s like a faithful companion, providing support during challenging times and adding joy to celebrations. It’s capable of bridging cultural gaps and bringing us closer together.  So I wanted to ask all of you…. unlike me, most of you have had the opportunity to visit other countries. Did you have a chance to listen to the local music? Is there a song or genre of music you don’t quite understand but still listen to because you like the vibe or because it makes you feel good? Or perhaps it helps you concentrate? Or If you’re curious about music from another country that you’d like to explore? 

Without music life would be a mistake Read More »

Carepal

In a whirlwind of technology and innovation, I recently had the privilege to participate in a Hackathon at Georgian College, a gathering that proved to be both a challenge and an exhilarating opportunity to push the boundaries of artificial intelligence (AI) in solving real-world problems. Presented with four themes—information security, healthcare, smart cities, and sustainability—my team and I embarked on a journey to find a meaningful application of AI that could make a tangible difference in people’s lives. After several hours of brainstorming and discussion, we were drawn to healthcare, a field where AI’s potential to improve lives is both vast and deeply personal. The spark for our project came from a simple yet profound observation: a team member shared how assisting a senior neighbor with technology brought her immense joy and highlighted a critical need—many seniors live alone, often without the assistance they need. With over 42% of Canadian seniors living alone, we saw a clear opportunity to make a difference. Thus, CarePal was born. CarePal is not just another piece of technology; it’s a proactive AI companion designed to perform wellness checks, ensure medication adherence, provide company, detect behavioral trends, and alert caregivers to emergencies or anomalies. What sets CarePal apart is its unparalleled accessibility, offering connectivity across various devices to accommodate seniors with audio, visual, or speech impairments. Leveraging the power of COHERE’s API—a Canadian enterprise specializing in generative AI solutions—we equipped CarePal with a large language model enhanced by retrieval augmented generation. This foundation allows CarePal to offer not just interaction, but truly insightful and helpful engagement, tailored to the unique needs of seniors. Developing CarePal was a marathon of innovation, requiring around 20 hours of dedicated work. Our team was a blend of talents, divided into three key roles: Hackers: The tech wizards who brought the first prototype of CarePal to life. Business Development: That’s where I contributed, diving into business research, branding, and development to ensure CarePal’s market readiness and impact. The Hustler: The charismatic force who pitched our product, presenting CarePal’s potential to transform senior care. Our journey culminated in the Hackathon’s finals, where CarePal was awarded second place—a moment of immense pride and validation for our hard work. But beyond the accolades, the experience was a profound reminder of the power of technology to make a difference in the lives of those who need it most. As we move forward, our experience at the Georgian College Hackathon remains a beacon of what’s possible when innovation meets empathy. CarePal is just the beginning. The journey of using technology to enhance human lives is endless, and I am eager to continue on this path, wherever it may lead. For a closer look at our pitch and the story of CarePal, check our pitch video here.  

Carepal Read More »

Quantum Physics made me do it

In the realm of quantum physics, where particles can exist in multiple states simultaneously, entangled across vast distances, defying  the classical rules that govern our macroscopic world. I found a unexpected but rather interesting inspiration in the form of a book called ” Quantum Physics made me do it”, it has given me a new perspective to my understanding of the universe and to some extent my approach to life and decision-making. Quantum Physics challenges the solid ground on which we have built our understanding of reality. It introduces a world where particles like electrons and photons  dance the realm of probabilities, existing in several places at once, spinning in two directions simultaneously, and influencing each other instantaneously over vast distances. This quantum weirdness, with its part particles living in superposition and entangled states, offers a compelling metaphor for the complexities of human existence and the interconnectedness of all things. The principle of super position, where quantum entities like electrons can exist in multiple states simultaneously, mirrors the multifaceted nature of our identities and choices. Just as a quantum particle doesn’t settle on a state until its observed, our paths in life remain open, full of potential, until we make a decision. This realization empowered me to embrace uncertainty in life, viewing each decision not as a closure of possibilities but as a step into a new realm of potentialities. Entanglement, another quantum marvel, suggests that particles can become linked, so the state of one instantaneously influences the state of another, no matter the distance between them. This concept resonated with me on a personal level, highlighting the deep connections we share with others. It served as a reminder that our actions and energies’ are interwoven with those around us to some extent, often in ways we cannot see or immediately  understand. Quantum physics, with its uncanny parallels to the intricacies of life, has given me a new perspective on the nature of reality, the illusion of differences, and the profound interconnectedness  of the universe. It’s a reminder that there are more things in heaven and earth than are dreamt of in our philosophies. In embracing this quantum view, I’ve found a deeper appreciation for the mystery and beauty of existence. It’s a perspective that encourages curiosity, openness and a recognition of our shared journey through the vast, unfolding universe. It also offered a new lens through which to see the endless possibilities that life presents, teaching me that at heart of certainty lies a world brimming with an infinite potential. 

Quantum Physics made me do it Read More »

Alcohol Sales Regression Using AutoML

Introduction The project aims to tackle the challenge of predicting alcohol sales in Iowa, particularly focusing on the crucial December period when sales peak due to the Christmas season. Historically, liquor stores in Iowa have relied on a simple moving sales average of the past five years to forecast December sales. This method, however, has proven insufficient, as it fails to consider various influential factors such as day, region, product, and vendor, leading to inaccurate predictions. This has resulted in either stock shortages or excesses, causing financial losses either from missed sales opportunities or from the costs associated with unsold stock. Methodology The project employs AutoML techniques to develop a more accurate prediction model for December alcohol sales in Iowa. The methodology involves several key steps: Data Collection and Preprocessing: The team collected sales data, including historical sales figures, product types, vendor information, and regional sales data. This comprehensive dataset underwent preprocessing to clean and structure the data for analysis. Feature Selection: To address the limitations of previous forecasting methods, the project expanded the feature set to include not just historical sales data but also day of the week, region, product type, and vendor information. AutoML Implementation: The team utilized AutoML tools to automatically select the best machine learning model for the prediction task. AutoML evaluated various models based on the expanded feature set, optimizing for prediction accuracy. Model Training and Evaluation: The selected model was trained on a portion of the data, with the remaining data used for testing and validation. Evaluation metrics such as Mean Absolute Error (MAE), Root Mean Squared Error (RMSE), and R-squared were employed to assess model performance. Results The AutoML-based approach significantly outperformed the traditional moving sales average method. Key findings include: Improved Accuracy: The AutoML model demonstrated a substantial improvement in prediction accuracy, with lower MAE and RMSE values compared to the traditional method. Comprehensive Analysis: The inclusion of additional factors like product type and vendor information in the model allowed for a more nuanced understanding of sales dynamics. Model Performance: The R-squared value indicated a good fit between the model’s predictions and the actual sales data, suggesting the model’s effectiveness in capturing the variability in December alcohol sales. Conclusion and Recommendations The application of AutoML techniques in predicting December alcohol sales in Iowa represents a significant advancement over traditional methods. The project’s success highlights the importance of incorporating a broader set of factors into sales forecasting models. Recommendations for liquor store owners and suppliers include: Adoption of AutoML-based forecasting models for more accurate inventory planning. Consideration of regional sales trends, product preferences, and vendor performance in stocking decisions. Continuous data collection and model retraining to adapt to changing market conditions. Check out my Github profile for the code ! 

Alcohol Sales Regression Using AutoML Read More »

Case Study: How does a bike-share navigate speedy success?

Introduction This report presents a comprehensive analysis of data sourced from Divvy Bikes, Chicago’s prominent bike-share system. Divvy Bikes, operated by Lyft in partnership with the City of Chicago, provides detailed trip data that is invaluable for understanding urban mobility and bike-sharing usage patterns. This analysis leverages data organized in CSV format, focusing on various aspects such as ride ID, rideable type, start and end times, stations, and rider type (member or casual). Data Organization and Integrity The dataset comprises rows representing individual trips and columns detailing aspects of each trip. Key columns include ride ID, rideable type, start and end times, station names and IDs, latitude and longitude of stations, and rider type. The data’s integrity was verified through checks for completeness, accuracy, consistency, and by ensuring appropriate data types for each column. Analysis Objectives and Methods The primary objective of this analysis is to uncover patterns in urban transportation through bike-sharing usage, particularly focusing on the differences between casual riders and members, and how these insights can inform infrastructure and urban planning decisions. Tools used for this analysis include: Pandas: For data manipulation and analysis. Python: For overall programming needs and running analysis scripts. Jupyter Notebook: For documenting the analysis process. Tableau: For Data Visualizations. Key Findings Ride Length Analysis: The average ride length across all trips is approximately 11 minutes. A wide range of ride lengths was observed, with a maximum of around 1498 minutes, indicating potential outliers or long-term rentals. Day of the Week Analysis: Ride lengths vary by day, with weekends showing longer average ride lengths compared to weekdays, suggesting more leisurely rides or different usage patterns. The highest number of rides occurs mid-week, with a noticeable drop during the weekends. Net Demand: Divvy bikes experienced fluctuating daily net demand, with peak usage during summer months and commuter-heavy weekdays highlighting a clear pattern of increased demand for bikes in central business districts during morning and evening rush hours. Member vs. Casual Usage Patterns: Casual riders have longer average ride lengths compared to members, indicating a more leisurely use of the bike-sharing system. Members show more consistent usage throughout the week with a slight increase in ride lengths over weekends. Insights and Implications: There’s a clear distinction in usage patterns between weekdays and weekends, with weekends favoring longer, leisure-oriented rides. Mid-week days experience the highest volume of bike rides, suggesting a pattern of commuting or routine use.   Recommendations Based on the analysis, the following strategic recommendations are proposed to optimize the bike-sharing experience in Chicago: Targeted Marketing Strategies: Develop campaigns aimed at converting casual riders to members by highlighting benefits and cost savings for frequent use. Weekend Promotions: Introduce weekend promotions or guided tour routes to attract casual riders seeking leisure activities. Fleet and Station Management: Adjust bike and dock availability to accommodate observed peak usage times and patterns, ensuring optimal service for both member and casual riders. Conclusion The analysis of Divvy bike-sharing data provides valuable insights into the usage patterns of Chicago’s bike-share system. It highlights the differences in behavior between member and casual riders, offering a foundation for targeted strategies to enhance service offerings. These insights are crucial for stakeholders in making informed decisions to improve the bike-sharing experience and contribute to the overall urban mobility landscape in Chicago.

Case Study: How does a bike-share navigate speedy success? Read More »

Social Anxiety and seeking discomfort

Social anxiety is not just about being shy or introverted. It’s a constant battle, a crippling fear of social interactions that can make everyday activities feel insurmountable. For many of us in our twenties, it’s like walking a tightrope between wanting to make meaningful connections and being paralyzed by the thought of interaction. Moving to a new country amplifies these feelings. You’re not just adapting to a new culture but also trying to find your place within it. It’s a journey of self-discovery, filled with highs and lows. In my case, moving from Mumbai to Canada for further studies introduced me to a whole new world. The transition from studying Artificial Intelligence and Big Data Analytics to working as a library associate in Barrie’s public library wasn’t just a career shift; it was a leap out of my comfort zone. The library, far from the quiet sanctuary many might imagine, became my arena. Every day, I was forced to interact more, challenge my social anxiety, and slowly find comfort in the discomfort. It’s been a quiet a journey of pushing boundaries, from taking up new hobbies like photography and biking to embracing the community that surrounds me. This path hasn’t been easy. The feeling of being alone, even when surrounded by people, is a constant companion. Yet, it’s also a reminder of the strength it takes to face our fears head-on. In my twenties, trying to figure out what I’m good at, I’ve learned that sometimes, what we’re truly good at isn’t tied to our degrees or job titles. It’s found in the small victories, the moments we choose to step out of our comfort zone, and the connections we dare to make despite the fear.   Crippling social anxiety may be part of my story, but it’s not the entire narrative. It’s a chapter that has taught me resilience, empathy, and the courage to keep moving forward, one step at a time. And for anyone walking a similar path, remember, you’re not alone. Together, we can navigate the complexities of our twenties, finding our strengths and making our mark, one interaction at a time.

Social Anxiety and seeking discomfort Read More »

बारिश (Rain)

Theres always something about a cup of chai and some pakoras (an Indian snack) that warms your heart along with the crisp sound of rain to bring peace to your mind. For me Rain has always been a positive experience. In all honesty living and growing up in Mumbai where it rains for over six months, I used to have mixed feelings about it, But I do remember the best memories I have had from my college years were in the rain. I remember the time where I used to go out hiking on Sundays, get drenched and be drenched for over 12 hours. I remember the top of the mountains where you literally feel like you are above the world just floating over clouds and then for a split second it clears up and you can see the view oh the view there are no words that can describe it. Besides the physical joy of being in the rain, I could never forget the colors it brought with it, the smell of the wet earth, the steady white noise that just felt like a lullaby to me, which calmed my mind and for those moments all the anxieties I had just seemed to melt away.When I moved to Canada this love for rain just intensified. Here it was much softer much pleasant. Here I could go out sometimes to just soak it in sit on a bench or bike around the city or take a hiking trail and I don’t have to worry about open manholes or getting stuck in traffic. Here I get to enjoy it.Being a pluviophile is a testimony in itself for having found peace in what most people would tag as the weather for mourning. From heavy monsoons in Mumbai to gentle rains in Canada, every drop of rain had interwoven different stories in my life, telling me to find joy in simple moments. For fellow pluviophiles, maybe even those yet to be, hopefully, this post will cause you to see the rain differently. Maybe when the skies turn grey again and the rain starts to fall, you too will have had a moment of peace and reason to smile, as I have done.

बारिश (Rain) Read More »

Case Study: A Century of Natural Disasters: Unveiling the Global Impact, Trends, and Response
I was just six years old then, naive to the world’s complexities and the forces of nature. When the skies over Mumbai opened up like never before, unleashing a flood that would go down in history as one of the most devastating natural disasters the city has ever faced. As a child, the endless rain, the sounds of chaos, and sight of a whole city underwater are etched into my memory, a reminder of natures unforgiving power. Yet, this experience pales in comparison to the cumulative impact of natural disasters over the last century. From earthquakes that have reshaped cities to hurricanes that have rewritten the fate of entire regions, these events have not only caused immeasurable loss but have also ignited a global conversation on climate change, disaster preparedness, and resilience. In this case study I dove deep into the multifaceted world of natural disasters recorded all the way from back in 1900 up to the year 2021. I successfully explored the evolution of disaster frequency, Severity, and types while investigating their human, economic and consequences. Furthermore, I also assess the effectiveness of governmental and aid organizations’ responses to these calamities, uncovering potential areas for enhancing disaster preparedness and resilience. This analysis not only reflects on the past century’s challenges but also contributes to the ongoing global dialogue on climate change and disaster management strategies. Historical Overview It’s impossible not to feel a mixture of awe and heartbreak while working with this dataset. The last century alone has witnessed events of such magnitude that they’ve permanently altered the course of human history. The 2004 Indian Ocean tsunami, for instance, claimed over 230,000 lives across 14 countries, underscoring the indiscriminate power of nature. The 1989 Loma Prieta earthquake shook Northern California, leaving a tangible mark on both the landscape and the community’s collective memory. The sheer volume of data available today, compared to even a few decades ago, allows us to analyze trends with greater accuracy and detail. This wealth of information not only helps in identifying patterns but also in preparing more effectively for future events. The plot above reveals that, over the past 100 years, natural disasters have not only increased in frequency but have also grown in complexity, with climate change playing a significant role in exacerbating their impact. However, improved reporting mechanisms and a growing global population also play significant roles. Human and Economic factors Dissecting the types of disasters, it’s fascinating yet somber to note the disparity between their commonality and severity. Floods and storms, frequent and furious, have swept through communities, leaving behind stories of survival and resilience. Floods especially have claimed over 6 million lives. Yet, it’s the droughts and epidemics, less frequent but far more deadly, that have claimed over 20 million lives. This dichotomy underscores the importance of not just counting events but understanding their impact on human life. Geographically, Asia (especially Southern, South-Eastern, and Eastern Asia have recorded more than 3000 disasters), the Americas (both South and North), and Africa (Eastern and Western regions) are notably prone to natural disasters. This underscores the need for targeted disaster preparedness and response initiatives in these areas. Certain disasters have left indelible marks on history due to their magnitude. The 1931 China floods, the 1917 epidemic in the Soviet Union, and the 2011 earthquake in Japan are stark reminders of nature’s formidable power. Furthermore. reflecting on the economic ramifications, the 2011 earthquake in Japan, with damages nearing $210 billion, and the 2005 storm in the United States, with costs around $125 billion, illustrate the profound economic impacts of these events. Japan’s 1995 earthquake, causing roughly $100 billion in damages, underscores the nation’s seismic vulnerabilities. Improving disaster preparedness and response is a multifaceted challenge. It requires a holistic approach, from enhancing early warning systems to fostering community engagement. Conclusion Exploring the global impact of natural disasters over the last century has been both a humbling and enlightening journey. It serves as a reminder of our collective vulnerability and the strength we possess to confront these challenges. I encourage every reader to consider how they can contribute to a more resilient future, whether through local preparedness efforts or global climate action advocacy. Together, we can counter nature’s forces, not with defiance, but with understanding, preparation, and resilience.   Check out my Github for more visualizations: https://github.com/TirtheshJani/Case_Study_Natural_Disasters_1900_2021

Case Study: A Century of Natural Disasters: Unveiling the Global Impact, Trends, and Response Read More »

My Journey with Spark and Kafka

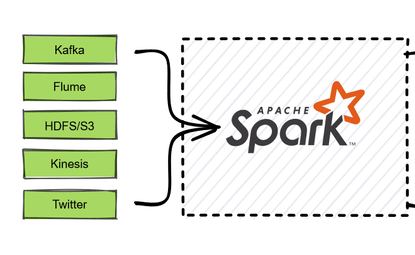
In the ever-evolving landscape of data processing, the quest for efficiency and precision seems endless. My latest project, an Employee Salary Processor built with Apache Spark and Kafka, stands as a testament to this ongoing journey. This endeavor was not just about harnessing data; it was about creating a seamless bridge between raw information and actionable insights. At the heart of this project lies Spark’s Streaming capabilities, coupled with Kafka’s robust messaging system. The goal was simple yet ambitious: to categorize employee salaries into high and low brackets in real-time, enabling dynamic decision-making for businesses. But as we all know, the simplest goals often require the most sophisticated solutions. The Blueprint Imagine a relentless stream of data, each piece a tiny puzzle of the bigger picture. My first step was to define a schema—a blueprint if you will—of the employee data, including fields like ID, Name, Department, and Salary. This schema served as the foundation, ensuring that each piece of data was recognized and correctly placed within our larger puzzle. The Stream : With Kafka set up as the source, data began its journey, flowing into our Spark application. This is where the magic happens. As data streamed in, Spark’s powerful processing capabilities kicked in, categorizing salaries with precision. High salaries were distinguished from low, each finding its path within our defined categories. The Insight: But what good is data if it cannot be interpreted? The high and low salary data streams were not just categorized; they were transformed into a format ready for analysis, then stored for accessibility. This dual path not only provided immediate insights but also laid the groundwork for future analysis, painting a picture of trends over time. The Impact : To the technical minds, this project is a symphony of Spark Streaming and Kafka, a showcase of real-time data processing and analysis. To the non-technical, it represents clarity—a clear, accessible view into the dynamics of employee salaries. This journey has been more than just technical execution; it has been a step towards demystifying data, making it accessible and understandable for all. Whether you’re a data scientist, a business leader, or simply a curious mind, the implications of this project extend far beyond its codebase. It’s about making informed decisions, understanding trends, and ultimately, about harnessing the true power of data. Check out the complete code on my Github: https://github.com/TirtheshJani/Data_Collection_and_Curation

My Journey with Spark and Kafka Read More »

Understanding Neural Networks using Math and Numpy

In this blog post, I’ll take you through my project journey, where I embarked on building a neural network from scratch using only NumPy. This endeavor was not just a programming exercise but a deep dive into the underpinnings of machine learning models. Whether you’re a seasoned coder or new to the tech world, I hope my experiences and insights can shed some light on the fascinating world of neural networks. The Genesis The first step was to import the necessary Python libraries: NumPy for numerical computations, Pandas for data manipulation, and Matplotlib for visualizing the data. These tools are staples in the data science toolkit, providing a robust foundation for handling and analyzing complex datasets.   My dataset resided in a CSV file, containing pixel values of handwritten digits along with their corresponding labels—a perfect dataset for a classification task. Using Pandas, I loaded the data and took a peek at the first few rows with df.head(). Each row represented an image of a handwritten digit, with the first column being the label (the digit) and the following 784 columns (28×28 pixels) the pixel values. Preprocessing The raw data needed to be converted into a format suitable for the neural network. I transformed the Data Frame into a NumPy array to leverage NumPy’s powerful numerical operations. Recognizing the potential for overfitting, I partitioned the data into training and cross-validation sets. This split would later help in tuning the model’s parameters to improve its generalization capabilities. The Neural Network The core of my project was the implementation of a simple yet effective neural network. The network consisted of two layers: a hidden layer and an output layer, each with its weights and biases. The initialization of these parameters was random, adhering to the principle that starting points matter in the journey of optimization. Activation Functions: Bringing Non-linearity To introduce non-linearity, I used the Rectified Linear Unit (ReLU) function for the hidden layer and the softmax function for the output layer. These choices are common in neural network architectures due to their computational efficiency and effectiveness in model training. Forward Propagation: A Leap of Faith The forward propagation process involved calculating the linear transformations and activations for both layers. This step was crucial for generating predictions from the input data.   Backward Propagation: Learning from Mistakes Learning in neural networks occurs through backward propagation. By comparing the predictions with the actual labels, I computed gradients for the weights and biases. This information directed how to adjust the parameters to reduce the error in predictions. Iterative Optimization The training process was iterative, employing gradient descent to update the parameters in small steps. Each iteration brought the model closer to its goal—minimizing the loss function and improving its accuracy on the training data. Results After numerous iterations, the model’s performance on unseen data (the cross-validation set) was promising. This success was a testament to the power of simple neural network architectures when armed with the right techniques and a systematic approach. This project was a profound learning experience, demystifying the workings of neural networks and reinforcing the importance of foundational principles in machine learning. It’s a journey that has just begun, with endless possibilities and challenges ahead. I hope this account of my project has illuminated some aspects of neural networks and inspired you to embark on your own projects. The blend of theory and practice in machine learning is a powerful tool for solving complex problems, and it’s within reach for anyone willing to learn and explore. Check out more projects on my Github profile: https://github.com/TirtheshJani/NN-with-math-and-numpy

Understanding Neural Networks using Math and Numpy Read More »